

By Joe Bastardi, Weatherbell Analytics
When the PDO turned cold, most of the meteorological and climate community understood that the pattern was turning very similar the last time of the PDO reversal, the 1950s, and it was a matter of time before the global temperatures, which have leveled off, would start falling in the same herby jerky fashion they had risen when the PDO turned warm at the end of the 1970s. I am not going to rehash the sordid details of how the AGW crowd simply ignores the major drivers of a cyclical nature. We all know that. Nor am I going to question them as to why they believe a trace gas like CO2 (needed for life on the planet) with a specific gravity of 1.5 as compared to the atmospheres 1.0, was going to mix with air in a way to affect the earth’s temperatures. Instead I am going to drive home points I have been making since 2007 and are now dramatically validating.
The La Ninas of 2008-09 and now this one had rapid mid level temperature drops that followed their onset and this years was nothing short of the most dramatic mid tropospheric drop since the start of the millennium. It is much more plausible to believe that rapid cooling in the mid levels would have an effect at leading to extremes, rather than what the warmingistas claim, which of course is anything that happens. In any case, one very interesting level that cooled to record cold levels was 400 mb, the very levels that the so called trapping hot spots were going to show up because of CO2...again a neat trick since somehow CO2 was going to defy the laws of Gravity, since, as mentioned above, its specific gravity is higher than the atmosphere (of course even if it was, it a) has not been proven to cause warming and b) man’s contribution is so tiny as to render it a non item anyway in climate considerations.
However first came the flip in the PDO, seen nicely here on the Multivariate Enso Index chart, which clearly illustrates the colder Pacific when the earth was colder, the start of the warming period coinciding with the satellite era, and now.

Now from the AMSU site, the amazing one year drop in temperature, the orange tan line being after the El Nino of 2009/10, the purplish line this past year and one can see the green this year… we are near record cold levels again.
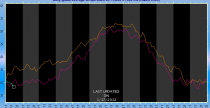
600 mb (14,000 feet) (enlarged)
And oh my my…the trapping hot spot itself.. 400mb or 25,000 feet… again record or near record cold
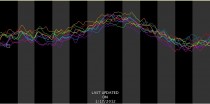
enlarged)
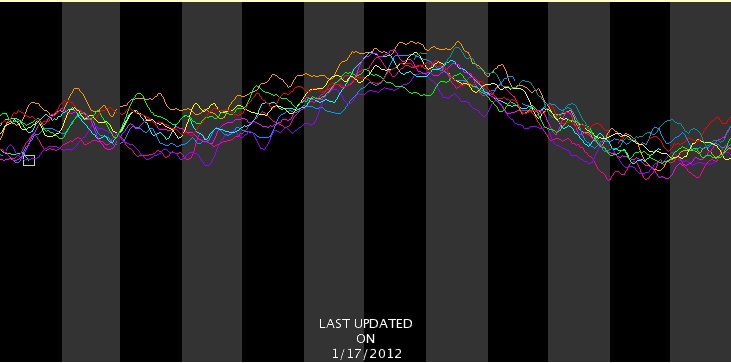
But the 2 meter temperatures, being in the boundary layer, do not respond as fast as the ocean, or a transparent atmosphere above
Nevertheless three downturns in a jagged fashion started predictably after the last El Nino now falling again in fits and spurts through December.
From Dr Roy Spencers site:
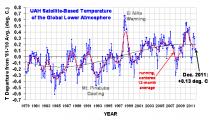
(enlarged)
In May, I forecasted the global temperatures to fall to -0.15C in one of the months - Jan, Feb or Mar this year, and perhaps as low as levels we saw in the 2008 La Nina. A rapid free fall has begun. Dr. Ryan Maue at his site (http://policlimate.com/weather/) maintains a plethora of useful forecast information including GFS global temp projections over the next 16 days.
They have been routinely reading greater than 0.2 C below normal and I suspect the Jan reading will plummet quite a bit from December with February even lower. An example of this can be seen with these two charts off Ryan’s site,
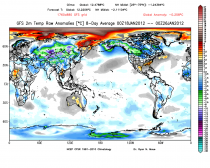
-0.258 C globally for 2 meters. (enlarged)

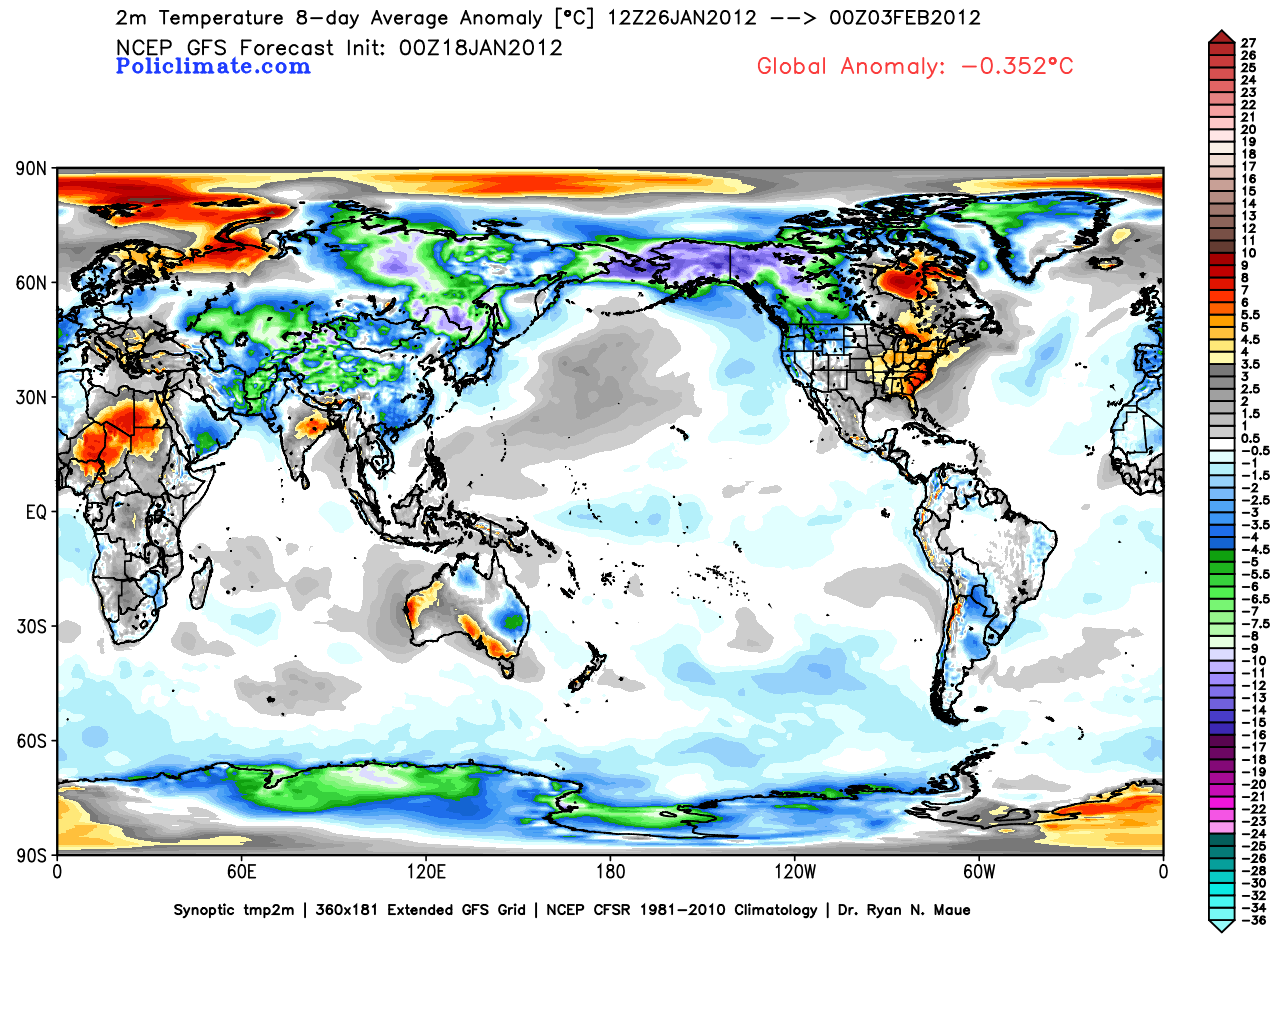
Day 8.5-16 a whopping -0.352 C (enlarged)
The reason the arctic looks warm is that it has been stormy, and when it’s windy the air is well mixed and so the temperatures are not as low as if it’s calm, but it’s still frigid. Notice in the second map, that the arctic cools because the arctic oscillation is starting to go negative, leading to higher pressures and lighter winds. But the most astounding aspect of this is the northern hemisphere mid latitude temperatures, at -2.1 C.
Currently, with gas so high because we are being handcuffed by an administration that won’t drill (if gas was a 1.50 lower, it would be worth a half trillion dollars to the economy) and an EPA that is causing untold economic damage (I would conservatively etiolate a half trillion dollars, from jobs lost to burdensome regulations) along with a 100 billion dollar subsidy to fight global warming world wide, it is costing each ACTUAL TAX PAYER close to 7000 dollars (1.1 trillion divided by 150 million tax payers).
One has to wonder, how even the most dogmatic of them don’t look at the actual facts, how they can continue to carry on their denial while the results of such things handcuff the American economy and cause untold misery for many as our wealth is not only redistributed, but dwindles. One can only conclude this is being done on purpose, and with purpose.
See By Joe Bastardi, Weatherbell Analytics
When the PDO turned cold, most of the meteorological and climate community understood that the pattern was turning very similar the last time of the PDO reversal, the 1950s, and it was a matter of time before the global temperatures, which have leveled off, would start falling in the same herby jerky fashion they had risen when the PDO turned warm at the end of the 1970s. I am not going to rehash the sordid details of how the AGW crowd simply ignores the major drivers of a cyclical nature. We all know that. Nor am I going to question them as to why they believe a trace gas like CO2 (needed for life on the planet) with a specific gravity of 1.5 as compared to the atmospheres 1.0, was going to mix with air in a way to affect the earth’s temperatures. Instead I am going to drive home points I have been making since 2007 and are now dramatically validating.
The La Ninas of 2008-09 and now this one had rapid mid level temperature drops that followed their onset and this years was nothing short of the most dramatic mid tropospheric drop since the start of the millennium. It is much more plausible to believe that rapid cooling in the mid levels would have an effect at leading to extremes, rather than what the warmingistas claim, which of course is anything that happens. In any case, one very interesting level that cooled to record cold levels was 400 mb, the very levels that the so called trapping hot spots were going to show up because of CO2...again a neat trick since somehow CO2 was going to defy the laws of Gravity, since, as mentioned above, its specific gravity is higher than the atmosphere (of course even if it was, it a) has not been proven to cause warming and b) man’s contribution is so tiny as to render it a non item anyway in climate considerations.
However first came the flip in the PDO, seen nicely here on the Multivariate Enso Index chart, which clearly illustrates the colder Pacific when the earth was colder, the start of the warming period coinciding with the satellite era, and now.
Now from the AMSU site, the amazing one year drop in temperature, the orange tan line being after the El Nino of 2009/10, the purplish line this past year and one can see the green this year… we are near record cold levels again.
600 mb (14,000 feet) (enlarged)
And oh my my…the trapping hot spot itself.. 400mb or 25,000 feet… again record or near record cold
enlarged)
But the 2 meter temperatures, being in the boundary layer, do not respond as fast as the ocean, or a transparent atmosphere above
Nevertheless three downturns in a jagged fashion started predictably after the last El Nino now falling again in fits and spurts through December.
From Dr Roy Spencers site:
(enlarged)
In May, I forecasted the global temperatures to fall to -0.15C in one of the months - Jan, Feb or Mar this year, and perhaps as low as levels we saw in the 2008 La Nina. A rapid free fall has begun. Dr. Ryan Maue at his site (http://policlimate.com/weather/) maintains a plethora of useful forecast information including GFS global temp projections over the next 16 days.
They have been routinely reading greater than 0.2 C below normal and I suspect the Jan reading will plummet quite a bit from December with February even lower. An example of this can be seen with these two charts off Ryan’s site,
-0.258 C globally for 2 meters. (enlarged)
Day 8.5-16 a whopping -0.352 C (enlarged)
The reason the arctic looks warm is that it has been stormy, and when it’s windy the air is well mixed and so the temperatures are not as low as if it’s calm, but it’s still frigid. Notice in the second map, that the arctic cools because the arctic oscillation is starting to go negative, leading to higher pressures and lighter winds. But the most astounding aspect of this is the northern hemisphere mid latitude temperatures, at -2.1 C.
Currently, with gas so high because we are being handcuffed by an administration that won’t drill (if gas was a 1.50 lower, it would be worth a half trillion dollars to the economy) and an EPA that is causing untold economic damage (I would conservatively etiolate a half trillion dollars, from jobs lost to burdensome regulations) along with a 100 billion dollar subsidy to fight global warming world wide, it is costing each ACTUAL TAX PAYER close to 7000 dollars (1.1 trillion divided by 150 million tax payers).
One has to wonder, how even the most dogmatic of them don’t look at the actual facts, how they can continue to carry on their denial while the results of such things handcuff the American economy and cause untold misery for many as our wealth is not only redistributed, but dwindles. One can only conclude this is being done on purpose, and with purpose.
See PDF with enlarged images.
Source: CNS News
Mark Levin says America cannot at the same time have a Constitution and an Environmental Protection Agency (EPA) that is doing what the EPA is doing today.
Levin made the observation in an interview with CNSNews.com about his new book, “Ameritopia: The Unmaking of America.”
Modern American liberals, who are Utopias, Levin said, aim to erode the separation of powers built into the U.S. Constitution so that a “relative handful of masterminds” can tell everybody else what to do.
“This erosion has been going on for about a hundred years,” said Levin. “It’s at a much faster pace right now and there’s a reason for this - because you can’t have constitutionalism and utopianism.”
“The purpose of the Constitution is to have a limited central government where the sovereignty remains with the individual and the people and the states,” said Levin. “The purpose of utopianism is the opposite of all that. It’s a relative handful of masterminds and their massive army of bureaucrats and their experts advising them from the colleges and so forth on how to run society.
“You cannot have an EPA and a Constitution at the same time doing what this EPA is doing,” Levin told CNSNews.com.
“You cannot have an NLRB deciding who gets to work where, how, and when, and at the same time follow the Constitution,” he said.
“You cannot have a tax code that serves basically the purpose of redistributing wealth, which is one of the things that Marx was pushing for so strongly, and at the same time be arguing about limited government and constitutionalism,” he said.
“The utopians reject history. Everything begins today,” said Levin. “The models they want to put in place begin today. So why anybody thinks they’re going to respect the Constitution when they don’t respect the rest of history is beyond me.”
In “Ameritopia: The Unmaking of America,” released Monday, Levin compares the Utopian political philosophy behind modern American liberalism with the vision of natural law, God-given rights and limited government that inspired the Founding Fathers to write the Declaration of Independence and the Constitution.
The Supreme Court last week heard arguments in the case of Sackett v. Environmental Protection Agency. The case was brought by an Idaho couple, Mike and Chantell Sackett, who were told by the EPA that they could not build a home on their own lot because the EPA said it might be a wetland - and that they could face a fine of $37,000 per day for defying the EPA’s order.
Don J. Easterbrook, Dept. of Geology, Western Washington University, Bellingham, WA
The recent Portland State University study of glaciers on Mt. Adams by is a good example of bad science, i.e., how a dogmatic bias and selectively leaving out contrary factual data can lead to bad conclusions. As an exercise in critical thinking, I used to have my graduate students take a paper like this apart, piece by piece, to show any scientific errors. Here is an analysis of bad assumptions and errors in the Mt. Adams study.
First, what are the basic contentions in this study?
1. Washington’s gradually warming temperatures have caused Mount Adams to shrink by nearly half since 1904.
2. The Mt. Adams glaciers are receding faster than those of nearby sister volcanoes.
3. The glacier recession is another sign of gradually warming temperatures.
4. The study lends urgency to an earlier federal report that shows the water content of Cascade Mountain snowpacks could dwindle by as much as 50 percent by the 2070s.
Let’s take a careful look at each of these. Have the Mt. Adams glaciers indeed shrunk by nearly half since 1904? How do we prove such a statement? The best way is to have photographic evidence of where the glacier termini were in 1904 and where they are now. For the moment, let’s assume they have shrunk significantly since 1904. But the rest of the conclusion (gradually warming temperatures have caused them to shrink) isn’t a logical consequence of smaller glaciers. Two important aspects of this question are (1) has the climate gradually warmed over the past 100 years and (2) what were the glaciers doing before 1904?
The answer to the question, has the climate gradually warmed over the past 100 years, is no, the climate has not gradually warmed - it has oscillated back and forth between warm and cool periods four times during the past century (Figure 1), and the glaciers have fluctuated back and forth with the climate changes. The inference that the Mt. Adams glaciers began to retreat near the turn of the past century and have gradually shrunk because of gradual warming due to increased CO2 is false.
>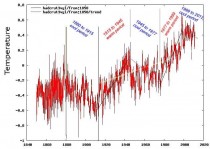
Figure 1. The climate during the past century has fluctuated through two periods of global warming and two periods of global cooling. Each time the climate cooled, the glaciers advanced; each time the climate warmed, they retreated.
The answer to the question, what were the glaciers doing immediately prior to 1904 is that they were strongly advancing during the 1880 to 1915 cool period, and many reached terminal positions close to their maximum extent during the Little Ice Age (1300 AD to this century) (Figure 2). Most of the subsequent retreat of the glaciers occurred during the following warm period from 1915 to 1945, well before CO2 began to rise sharply after 1945.
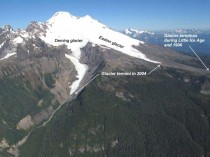
Figure 2. Position of glacier termini of the Easton and Deming glaciers on Mt. Baker (another Cascade volcano similar to Mt. Adams). The glacier termini in 1906 were close to their maximum Little Ice Age extent because of 30 years of strong climatic cooling from 1880 to about 1915. The recent glacier termini are at their minimum extent because of the preceding 20 years (1978 to 1998) of climatic warming.
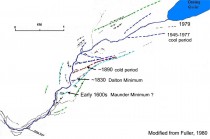
Figure 3. Successive positions of the terminus of the Deming glacier on Mt. Baker from the Little Ice Age to 1979. Each of these terminal positions corresponds to strong readvances of ice during periods of climatic cooling, separated by periods of glacial recession. The climate has been generally warming for 500 years coming out of the Little Ice Age, well before atmospheric CO2 began to rise after 1945, and has been characterized by alternating periods of warming and cooling to the present, not gradually warming because of increased CO2. The glaciers on Mt. Rainier and Mt. Adams show similar fluctuations.
Let’s look at the second contention--Mt. Adams glaciers are receding faster than those of nearby sister volcanoes. The advance and retreat of glaciers on two of those sister volcanoes, Mt. Baker and Mt. Rainier, has been well documented (Figure 4) (see references in Easterbrook 2011 and 2010).
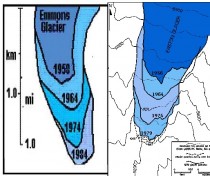
Figure 4a. Advance of more than 1 km of the Emmons glacier terminus on Mt. Rainer from 1958 to 1984. Figure 4b. Advance of the Easton glacier from 1956 to 1979
Glaciers on Mt. Rainier and Mt. Baker advanced strongly during the 1880 to 1915 cool period, retreated strongly during the 1915 to 1945 warm period, advanced again during the 1945 to 1977 cool period, and retreated during the 1978 to 1998 warm period. The contention that Mt. Adams glaciers are retreating faster than those on nearby volcanoes and that they have been retreating gradually since 1904 is false. Glaciers on Mt. Adams have not been gradually retreating and are ‘not retreating faster than the others’--all of these volcanoes have fluctuated strongly back and forth during each period of warming and cooling.
The third contention of the study, that glacier recession is another sign of gradually warming temperatures is only partially true. Although climatic warming does indeed cause glacier recession, the inference that gradual warming has caused gradual glacier retreat since 1904 is not true. The glaciers have clearly been periodically advancing as well as retreating.
The forth contention of the study, that the study lends urgency to an earlier federal report that shows the water content of Cascade Mountain snowpacks could dwindle by as much as 50 percent by the 2070s is totally unfounded. It assumes (1) that gradual climatic warming dating back to 1904 will continue at a constant rate until 2070, (2) that the supposed warming is continuous, (3) that the climate will continue to warm, and (4) that it is caused by increasing atmospheric CO2. The first assumption of gradual warming since 1904 has been shown above to be incorrect-there have been warming and cooling periods that have caused glaciers not only to retreat, but also to advance during this time. The assumption that the climate is presently warming is also not true--in fact, the climate has been cooling slightly since 2000, not warming, so projecting continuous gradual warming into the future is not warranted.
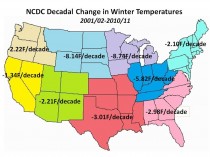
Figure 5. Winter temperatures in the US over the past decade. Note that temperatures in the Pacific NW have cooled at a rate of 2.22F per decade, not warmed.
The assumption that CO2 is causing climatic warming is also not true. Much of the glacial retreat was caused by climatic warming that occurred from 1915 to 1945, well before atmospheric CO2 began to rise sharply, so this warming cannot be attributed to rising CO2. In addition, the glacier readvance from 1945 to 1977 was caused by climatic cooling during the same time that CO2 was rising most rapidly, just the opposite of what should have happened if CO2 caused climatic warming.
So what credence can be given to the contention that Cascade Mountain snowpacks could dwindle by as much as 50 percent by the 2070s? Temperatures in the Pacific NW have been cooling over the past decade, not warming (Figure 5, 6) and the snowpack in 2010 was about 70-200% above normal. In the late summer of 2011, some areas normally snow-free were still covered with 30 feet of snow. Thus, the conclusion of Cascade snowpacks declining by 50% by the 2070s is not credible.
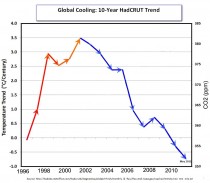
Figure 6. The trend of global temperature since 2001 has been cooling at a rate of -4.0C (-7F) per century. Computer models had predicted a 1F rise in temperature during this same period- that did not happen, showing that the computer models are invalid.
Summary
1. Rather than glacial retreat since 1904 due to gradual warming, glaciers have advanced and retreated four times in the past century.
2. Glacier termini advanced from 1945 to 1977 during the time of most sharply rising atmospheric CO2,. showing that rising CO2 does not cause climatic warming.
3. Glacier recession on Mt. Adams does not prove a gradually warming temperature.
4. No climatic warming has occurred during the past decade. Instead a cooling trend of -7 F per century has occurred.
5. Cooling during the past decade is not consistent with a claim of 50% reduction of Cascade snowpack caused by climatic warming.
6. The 1904 position of glacier termini resulted from strong cooling from 1880 to 1915. Comparing the position of recent minimal glacier termini following 20 years of warming from 1978 to 1998 with 1904 maximum glacier termini gives an exaggerated view of glacier recession.
7. Because glaciers on Mt. Rainier and Mt. Baker advanced and retreated four times in the past century, there is no basis for assuming that glaciers on Mt. Adams are retreating faster than those on nearby volcanoes.
References
Easterbrook, D.J., ed., 2011, Evidence-based climate science: Data opposing CO2 emissions as the primary source of global warming: Elsevier Inc., 416 p.
Easterbrook, D.J., 2011, Geologic evidence of recurring climate cycles and their implications for the cause of global climate changes: The Past is the Key to the Future: in Evidence-Based Climate Science, Elsevier Inc., p.3-51.
Easterbrook, D.J., 2010, A walk through geologic time from Mt. Baker to Bellingham Bay, WA: Chuckanut Editions, Bellingham, WA, 329 p.
PDF has enlarged images